
Real-time learning analytics, every signal in one place.
Real-time analytics in Diaposi shows how a live session is landing, slide by slide: attention, understanding, questions, poll and quiz answers, notes and drawings. You see it in your cockpit while you present, and get the whole report when you end. It is part of Diaposi, the free EdTech platform for interactive and measurable learning, for lectures, training sessions and conferences alike.
- Live while you present
- Every slide measured
- One report to share

Every signal Diaposi captures
Every tap, answer and question your room sends becomes a signal, gathered slide by slide in one place: live in your cockpit while you present, and in the report when you end.
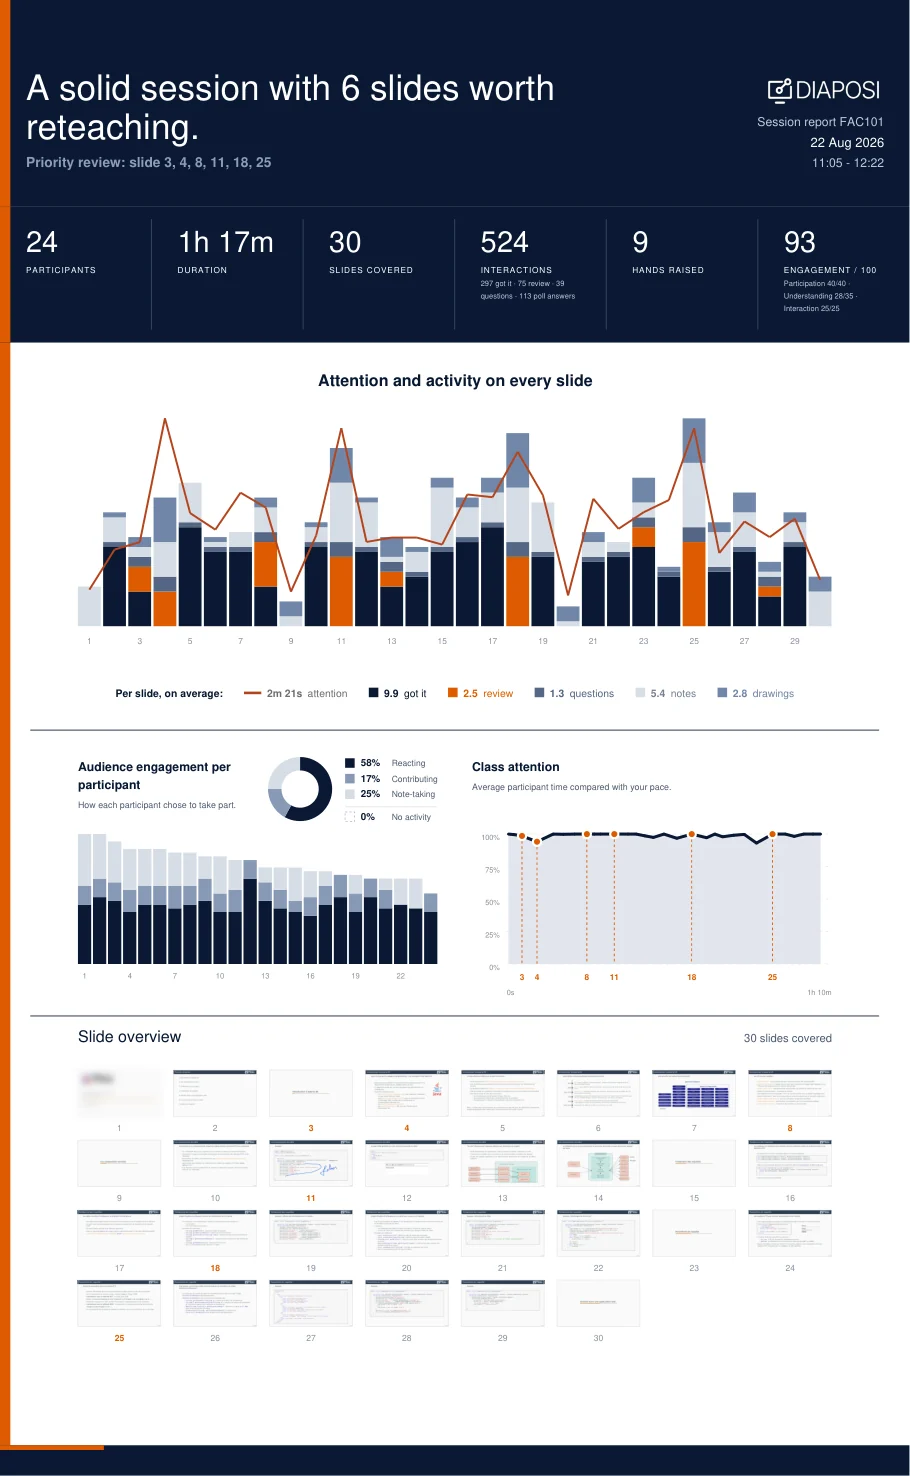
Attention on every slide
How long the room stays on each slide, beside how long you did, so you see where it held and where it slipped.
In sync
How much of the session each participant spends on the slide you are showing.
Active time
How long each participant is active in the session, from joining to the end.
Got it
A tap under the slide when a participant follows, counted slide by slide.
Review
A tap when a slide needs going over again, so you know where to slow down.
Class Pulse
Understanding, clarification or struggling on the slide in front of the room, live, while there is still time to act.
Anonymous questions
Every question, on the slide it came from, with the votes that show what most of the room wants to know.
Raised hands
A hand raised from a phone, without interrupting, counted for each participant.
Poll answers
Every answer to every poll, with its count and share, beside the slide it was launched on.
Quiz results
Every answer to every quiz, right or wrong, question by question.
Notes and drawings
How many notes and drawings participants make on each slide: a sign of where they are working.
Expectations
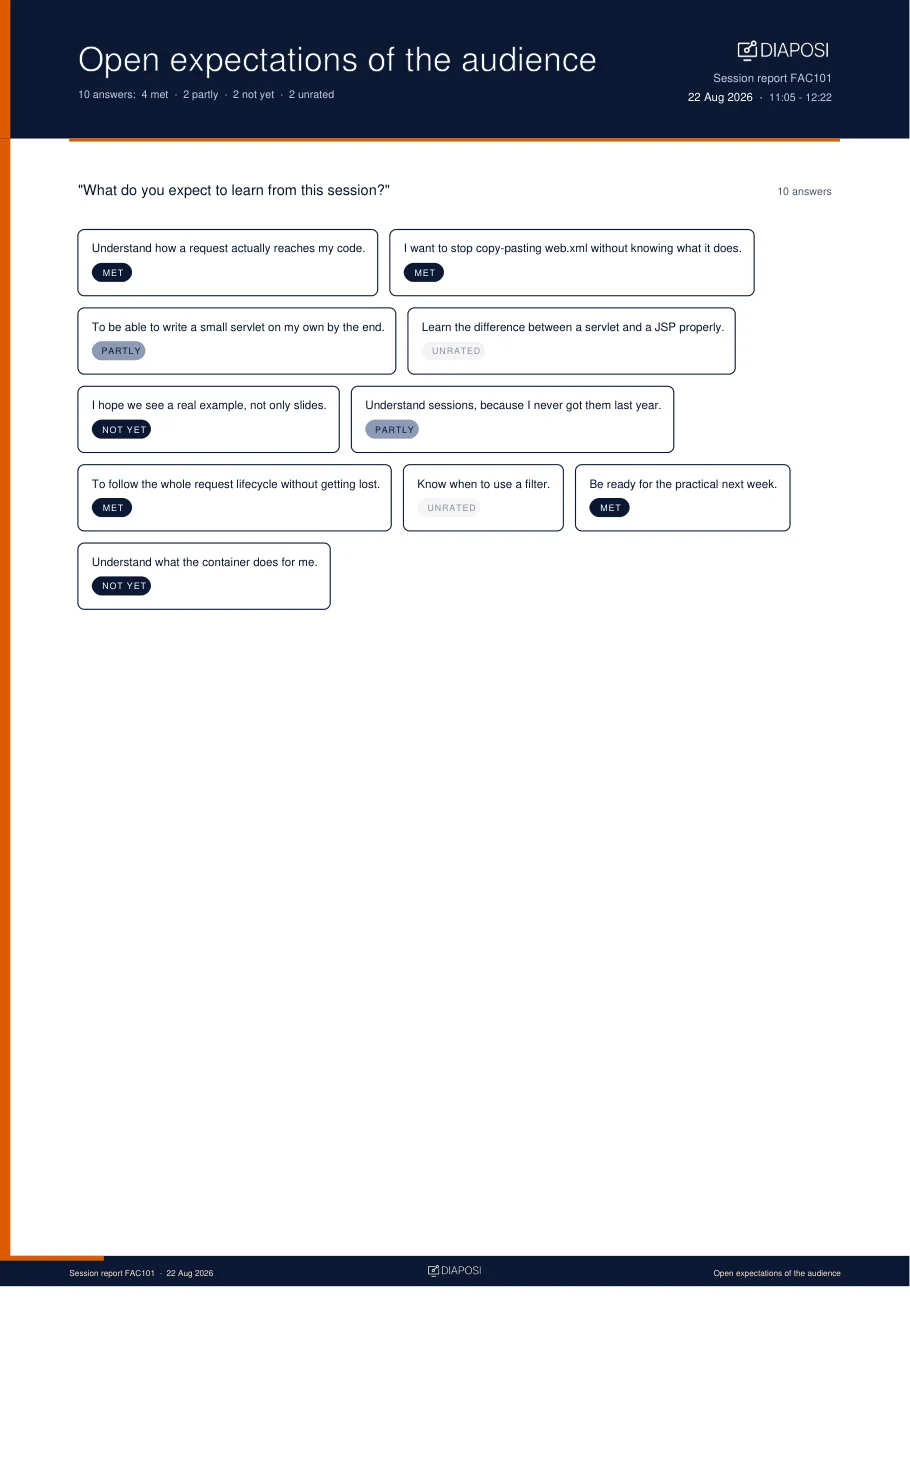
What each participant expects at the start, and whether it was met, partly met or not yet at the end.
Nothing to rebuild, nothing to change in the way you present
Teach, train or speak at a conference the way you always do. Diaposi gathers what lands and what does not, and gives you the whole debrief at the end of your session.

Live while you present, saved when you end
What your room sends shows up in your cockpit as it happens. When the session ends, it all becomes one report: a PDF to read and share, kept in your dashboard.
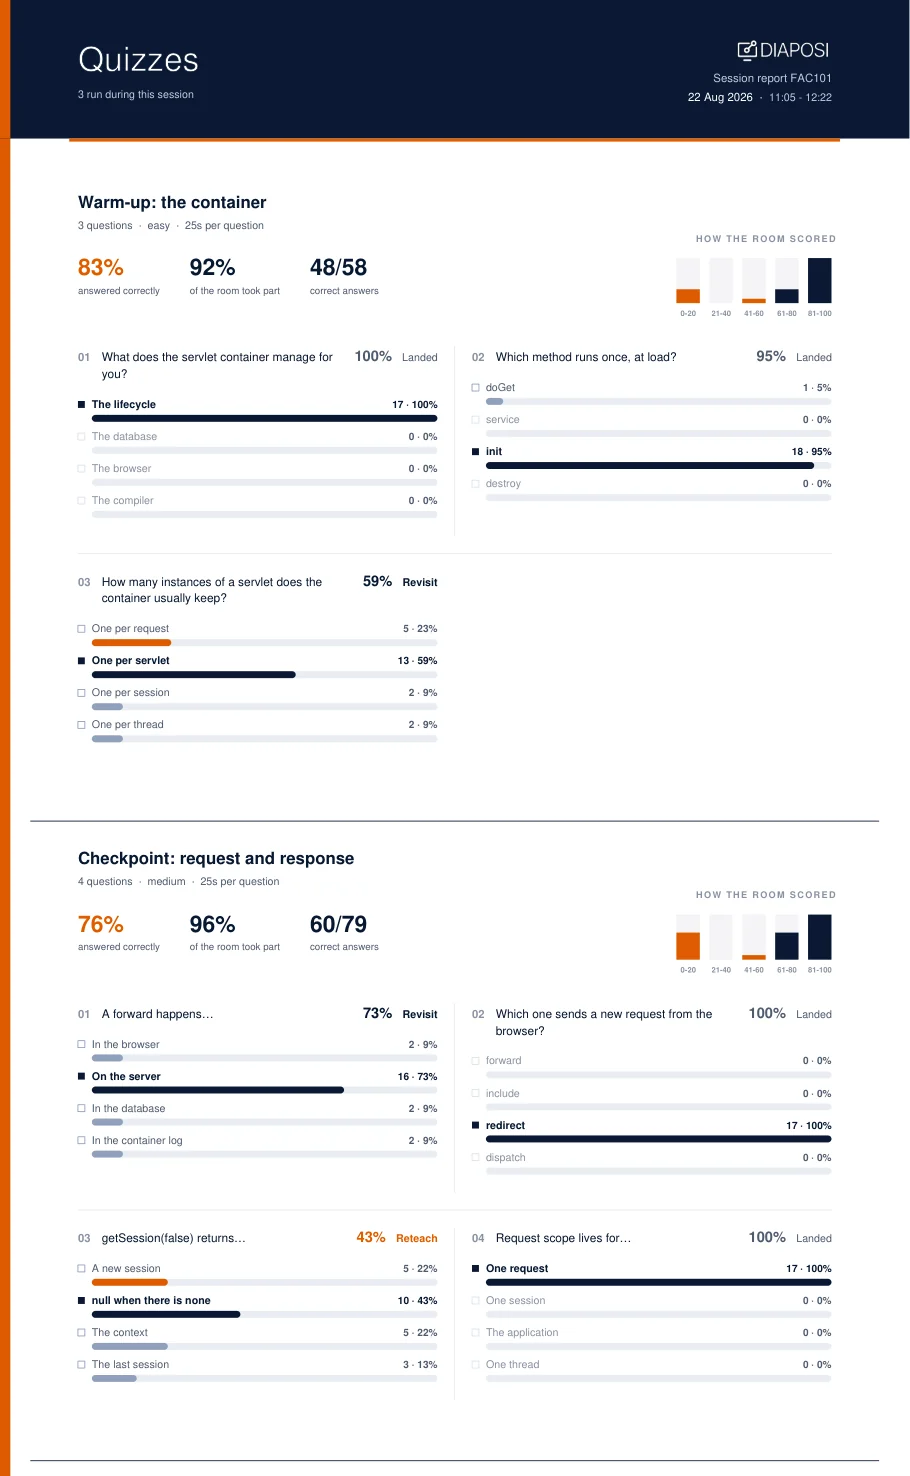
- Live in your cockpitThe class timeline and Class Pulse show how each slide is landing while you are still on it.
- One report when you endAttention and activity on every slide, engagement per participant, the room's expectations, every poll, every quiz and every question, in one document.
- A PDF to share, a CSV for ExcelDownload the report as a PDF to read and pass on, or as a CSV that opens straight in Excel or Google Sheets.
- Kept in your dashboardSave it and it waits in My reports, in your dashboard, ready to open again or share with colleagues for 12 months after the session.
On their side, the session works for them too
Participants send every signal from their own screen, and keep everything for themselves: to prepare, to revise, or to understand better what the document is teaching.

The same analytics, for learning on your own
Discover Diaposi Augmented LearningDiaposi Augmented Learning brings these signals to anyone who studies alone. Upload a PowerPoint, PDF or Word file, and every page you mark, every quiz you answer and every minute you spend on it builds a learning report of your own, filed in your learning journeys, free with an account.
- Your learning, measuredPages learned, questions answered, focused time, and a learning pulse made of your progress, confidence and recall.
- The hard pages firstThe pages you marked Review and the questions you missed come back as review cards, on a spaced schedule.
- Help where you are stuckLearn more explains any page another way, Quiz me tests the chapters you choose, and the same files can become a mock exam graded out of 20.

Every session and every document, measured in one place
Your past sessions and their reports, your learning journeys in their folders, your mock exams and quizzes with their grades: everything you teach and learn in Diaposi is kept and measured, so you always know what is understood and what needs another look.

Real-time analytics, answered.
What people ask before they measure their first session.
Host your interactive presentation with Diaposi
Upload the PowerPoint, PDF or Word file you already have and run polls, anonymous questions and quizzes from one cockpit, with a report when you end. Free to start, with no account.

Niels Bohr 
Louisa May Alcott 
Johann Sebastian Bach 
Helen Keller 
Jules Verne 
Caroline Herschel 
W. E. B. Du Bois 
Mary Shelley 
Max Planck 
Charlotte Brontë 
Leo Tolstoy 
Maria Gaetana Agnesi 
Mark Twain 
Hans Christian Andersen 
Erwin Schrödinger 
Booker T. Washington
Bring Diaposi to your institution
For a course, a department or a whole university. Diaposi makes every live session interactive and measurable, with the slides your staff already have. Tell us what you have in mind and we will get back to you.
- Every session measured: attention, participation and every answer, slide by slide.
- Works with the education ecosystem.
- No training on API dataAPI data is not used to train models.
- European infrastructureEncrypted across multiple EU zones.
- GDPR controlsEuropean data rights and controls.
- Mistral complianceSOC 2 Type II · ISO 27001/27701
Universities across Europe.