
Session analytics: the room live, the report after
While you present, see who is here, how each slide lands and what the room asks. When the session ends, one report keeps it all, slide by slide.
- Free to start, no credit card
- The report is saved by itself
What are session analytics?
Session analytics are the figures a live session produces: how many people answered, what the room asked and how each slide landed. In Diaposi, the host sees a pulse of the room, the questions and the votes while presenting. After the session, one report keeps it all slide by slide, with the questions and the poll and quiz results.
What you see while you present
Six signals beside your slides, as the session runs.
- Who is hereThe number of participants, their list and the session timer
- Session PulseGot it, Asking and Stuck on the current slide, with count and percent
- Time per slideHow long you have stayed on each slide
- Raised handsWho raised a hand, by name
- Poll votesThe answers as they arrive
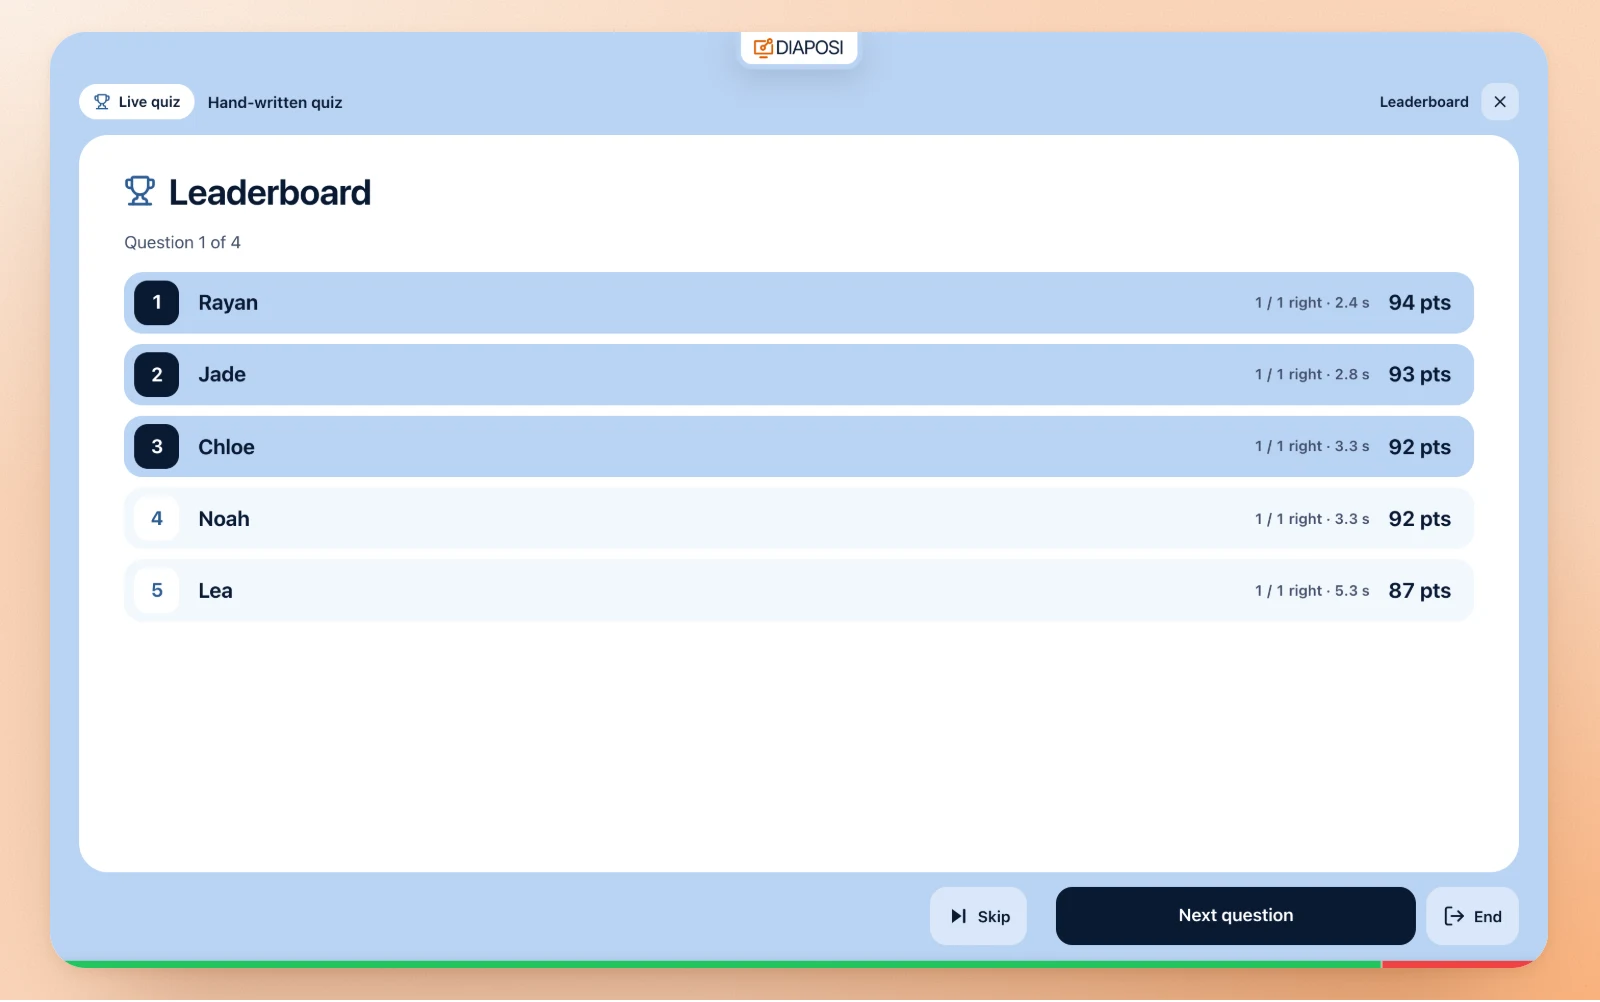
- QuizHow many answered, the leaderboard, the hardest and the easiest question
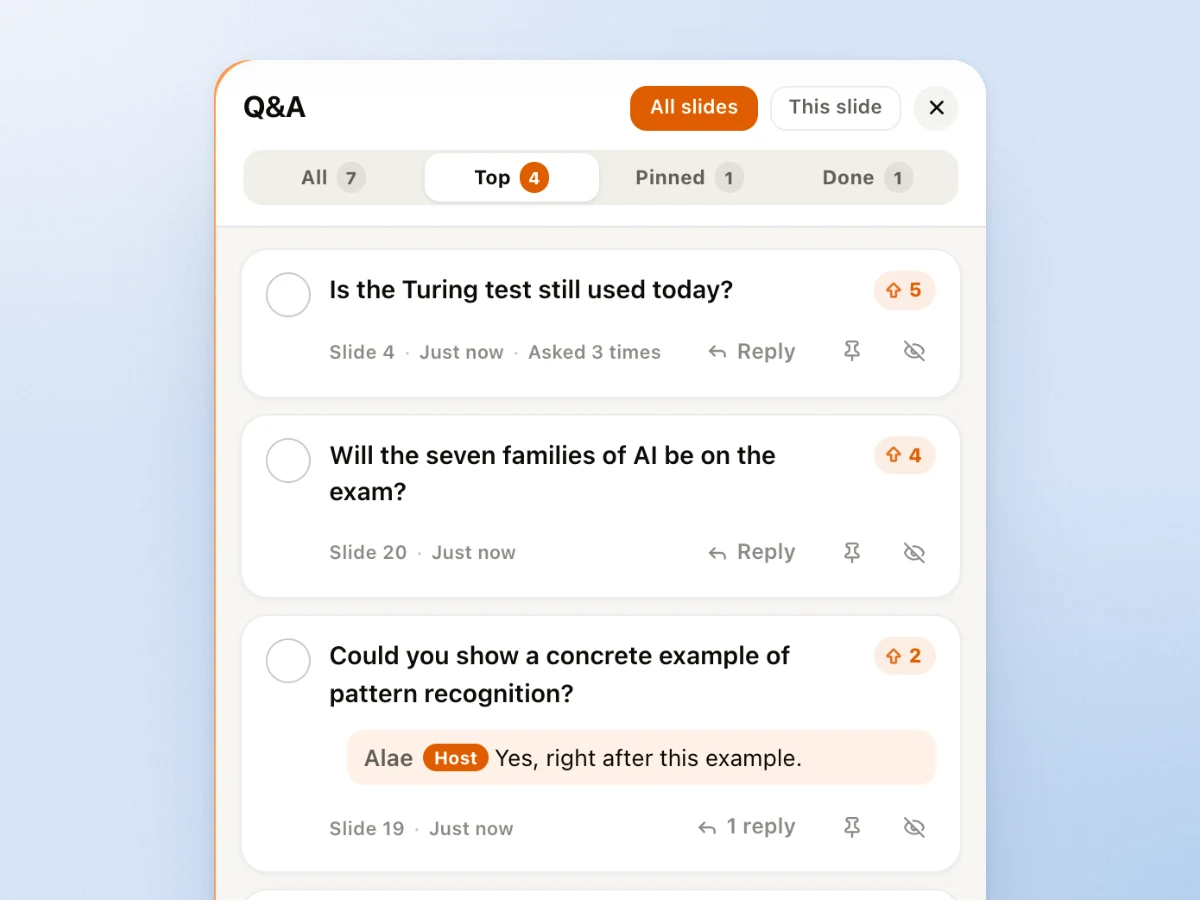
The questions of the room, sorted
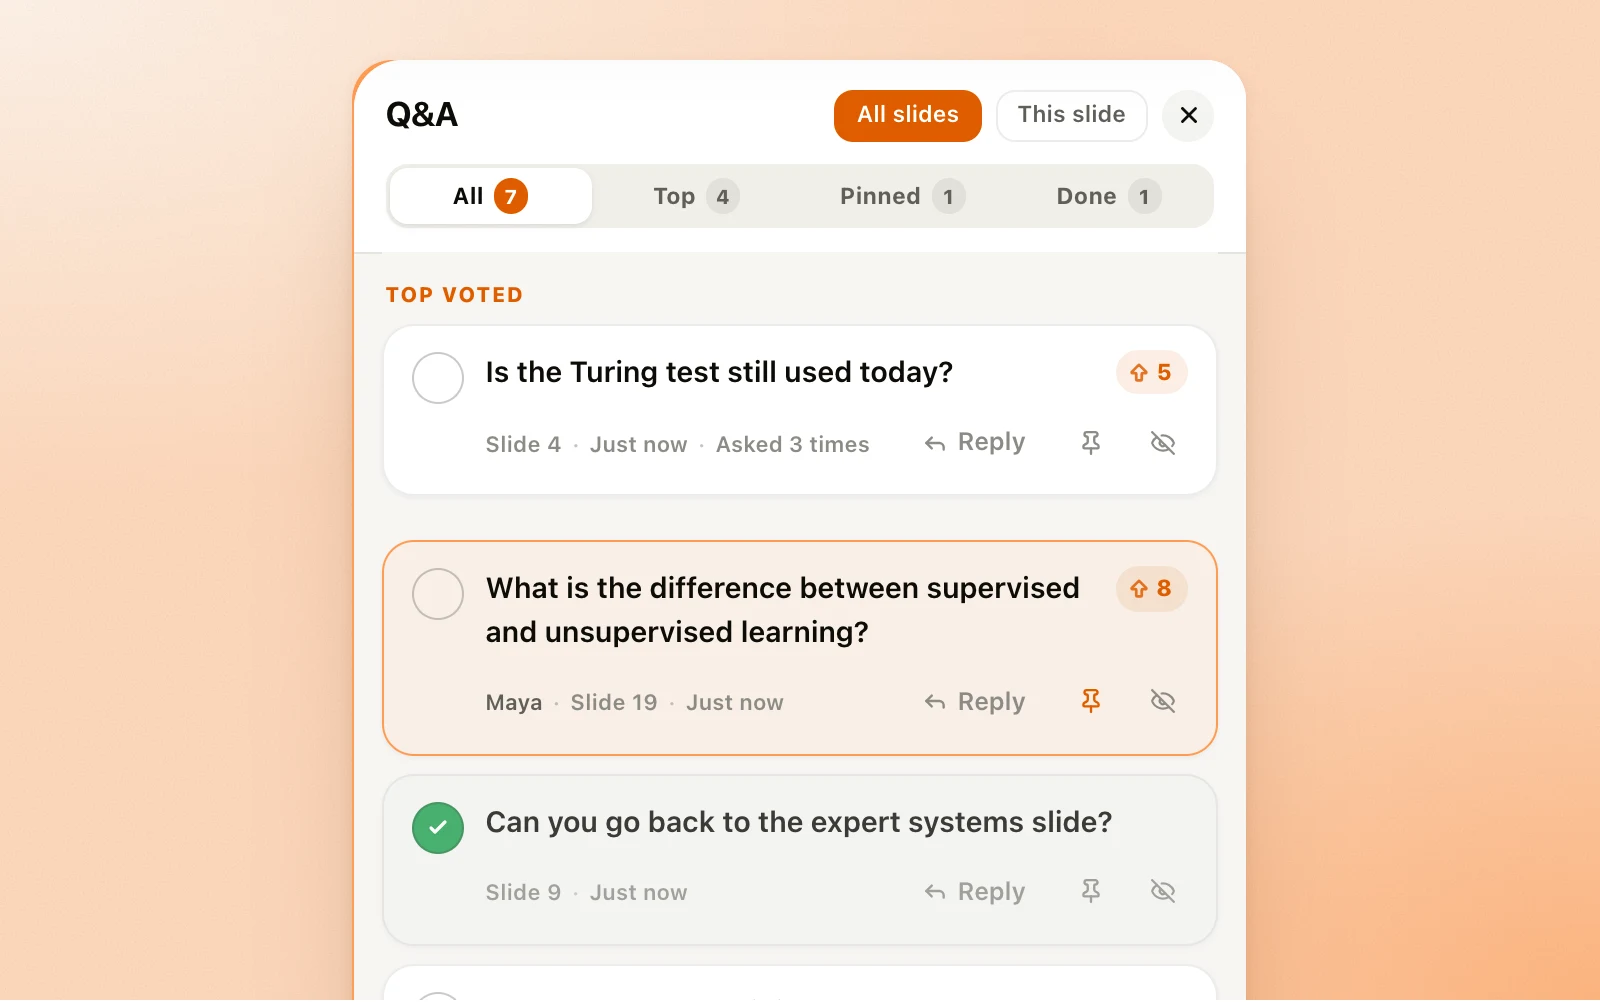
The Q&A panel shows All, Top, Pinned and Done, for every slide or the current one. A question asked twice is folded into one, with its votes added.
The quiz as it is played
See how many have answered each question, then the leaderboard and the podium, and which question was the hardest.
What the report holds
The session, slide by slide
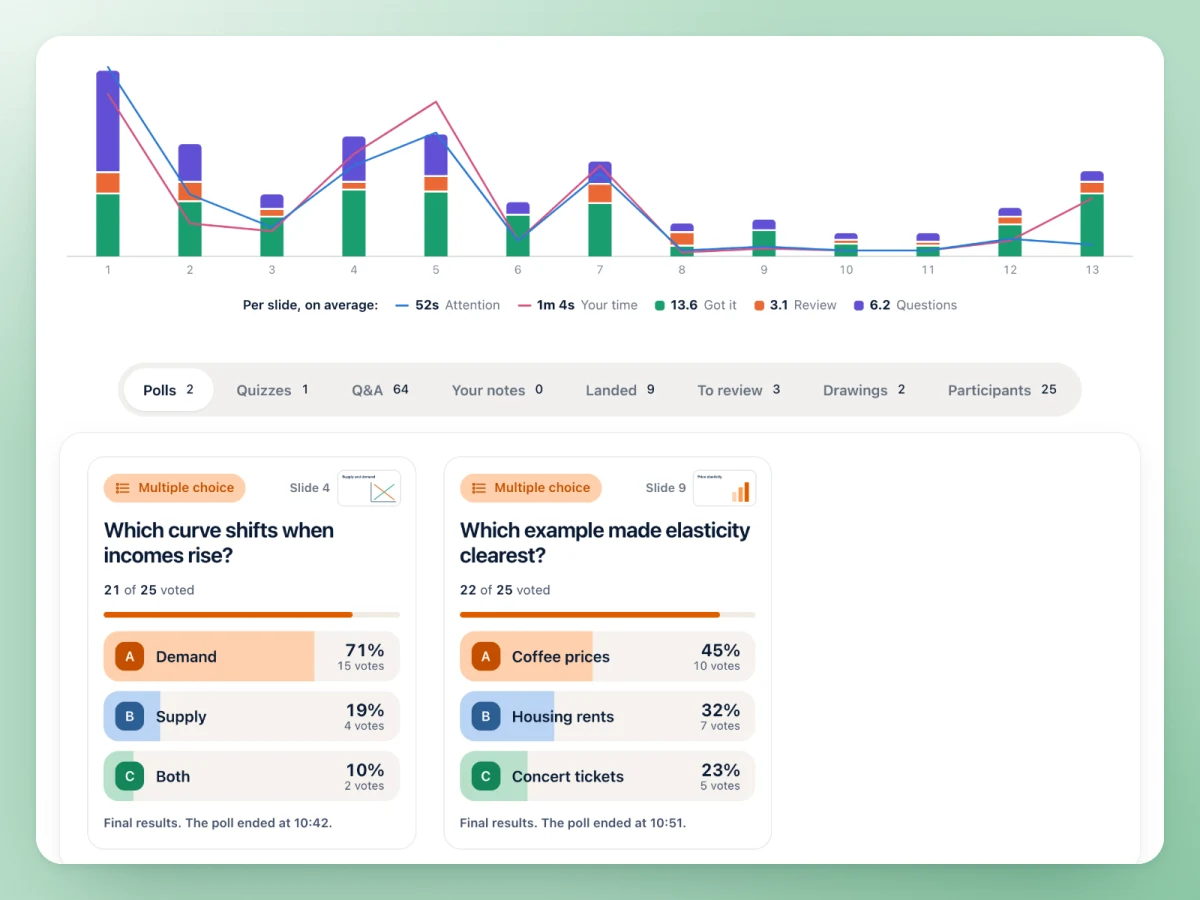
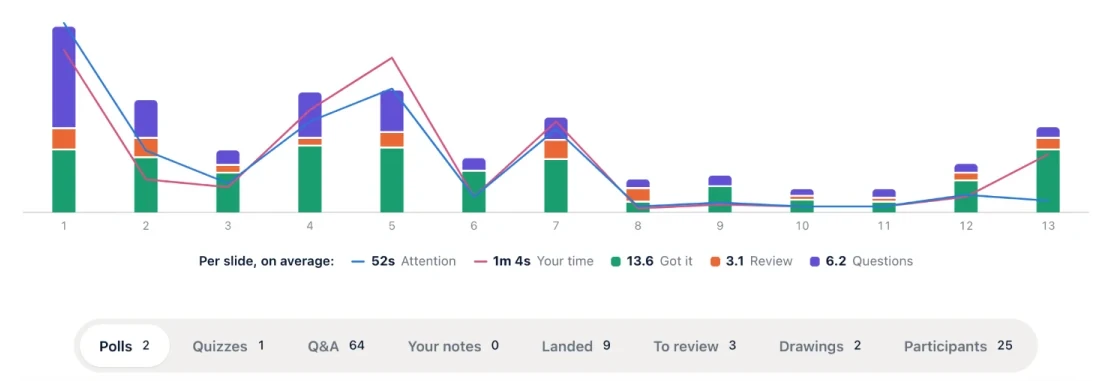
A chart sets your time on each slide beside the participants' time, with Got it, Review and the questions asked. Over it, four figures: the session time, how participants took part, the polls and quizzes you ran and a session score out of 100.
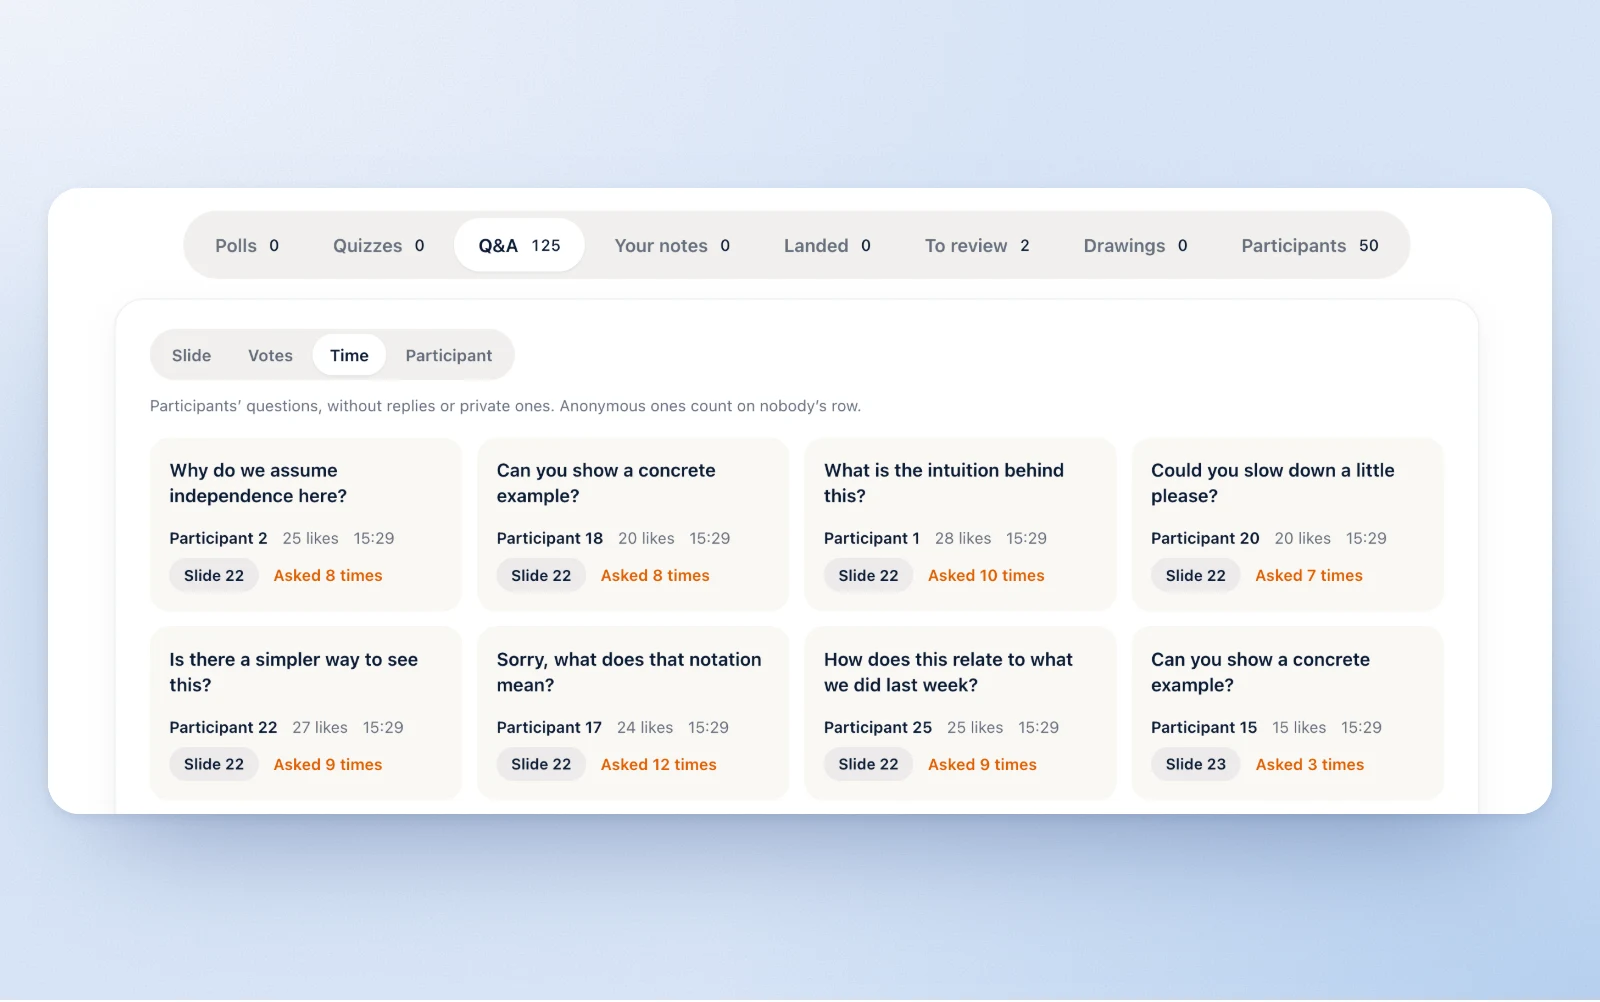
Every question the room asked
The Q&A tab keeps the questions on cards, sorted by slide, votes, time or participant. Questions sent to you in private are left out.
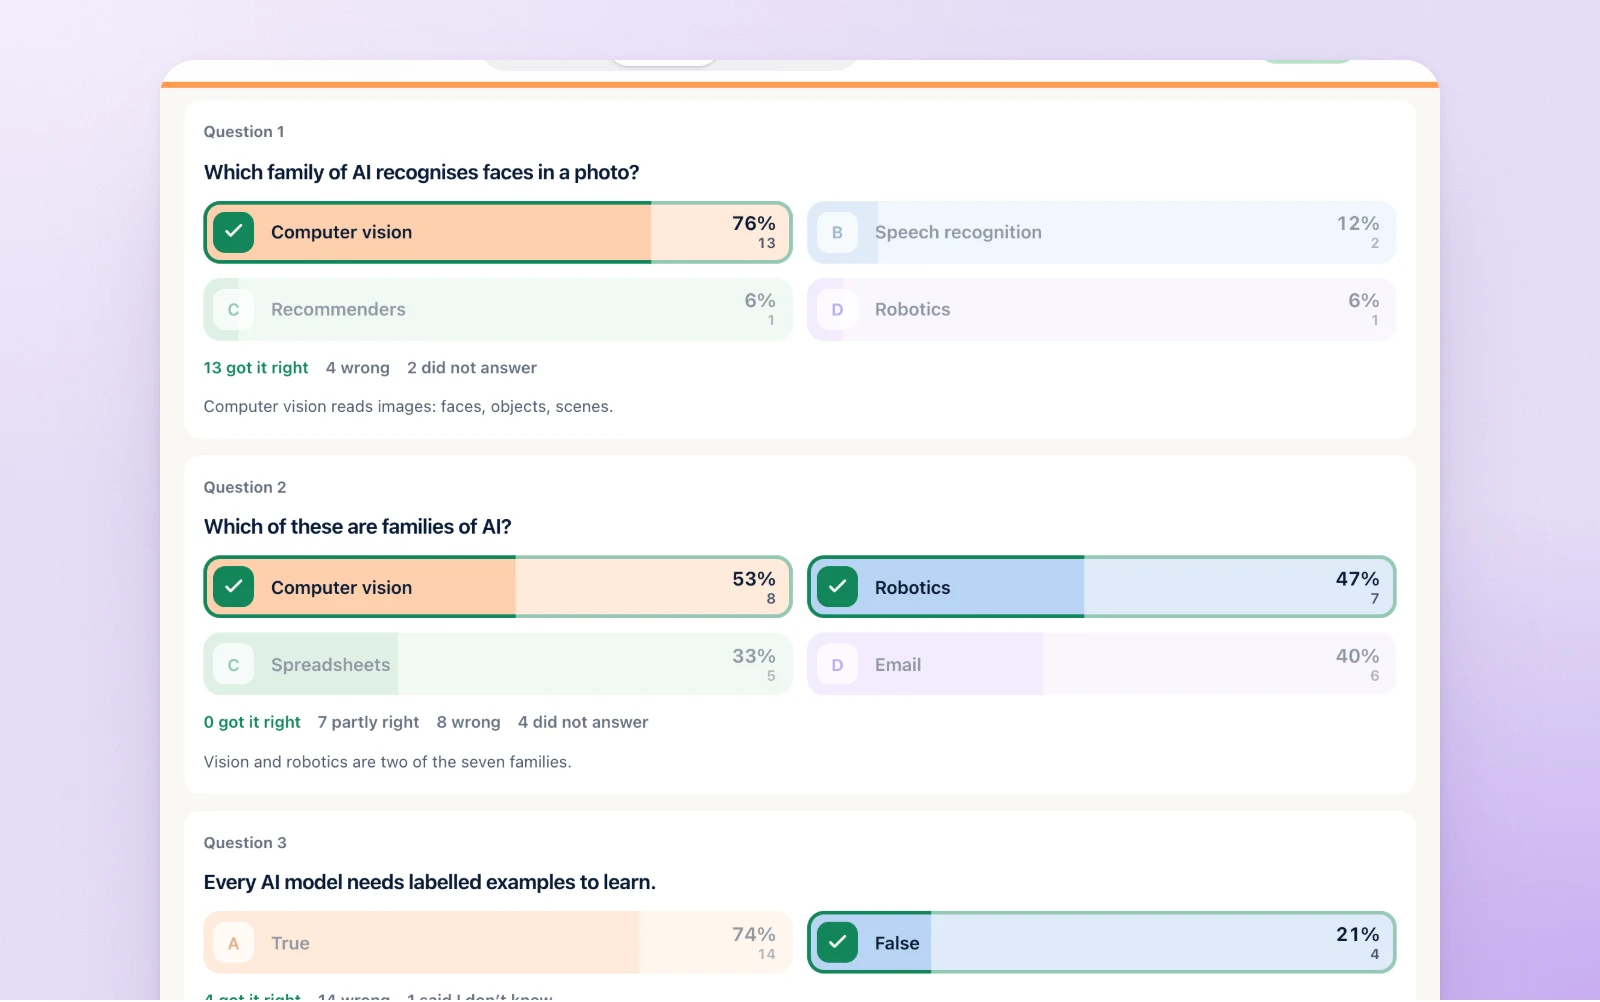
Polls and quizzes, question by question
Each question with how the answers split, the right answer, its explanation and the slide it came from.
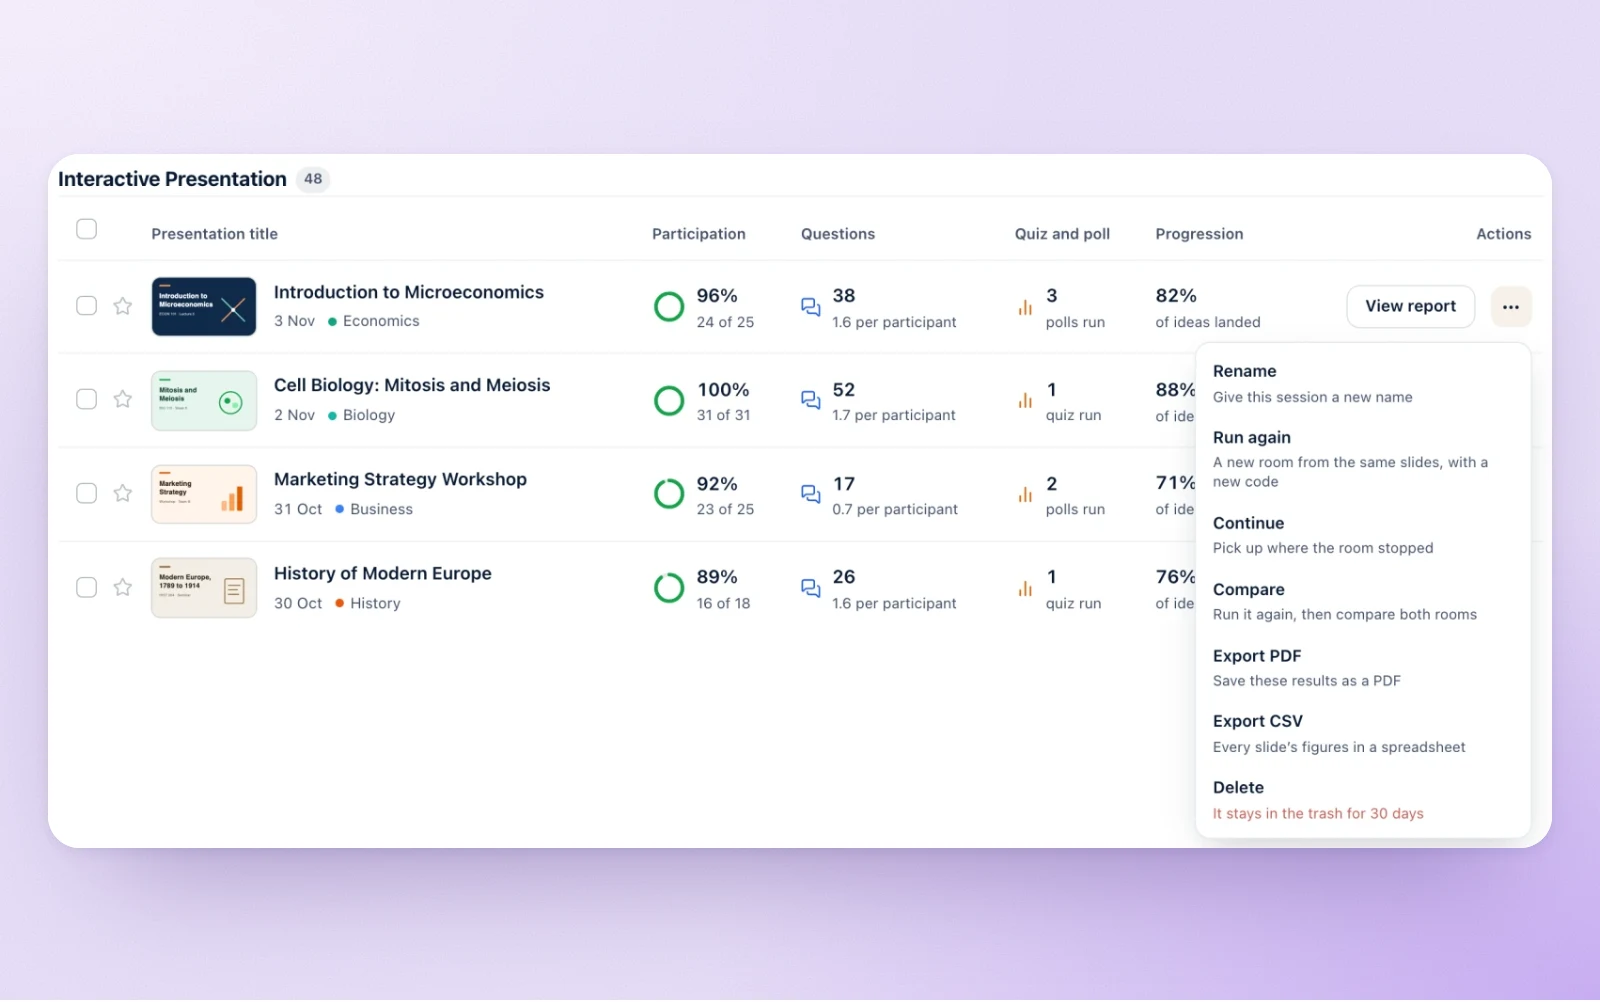
All your sessions in one list
Reports are saved to your account by themselves. Open a session again, rename it or run it again for a new group. Export to PDF and CSV, Compare and Progression come with Upgrade.
How to get the report of a session
Host your session
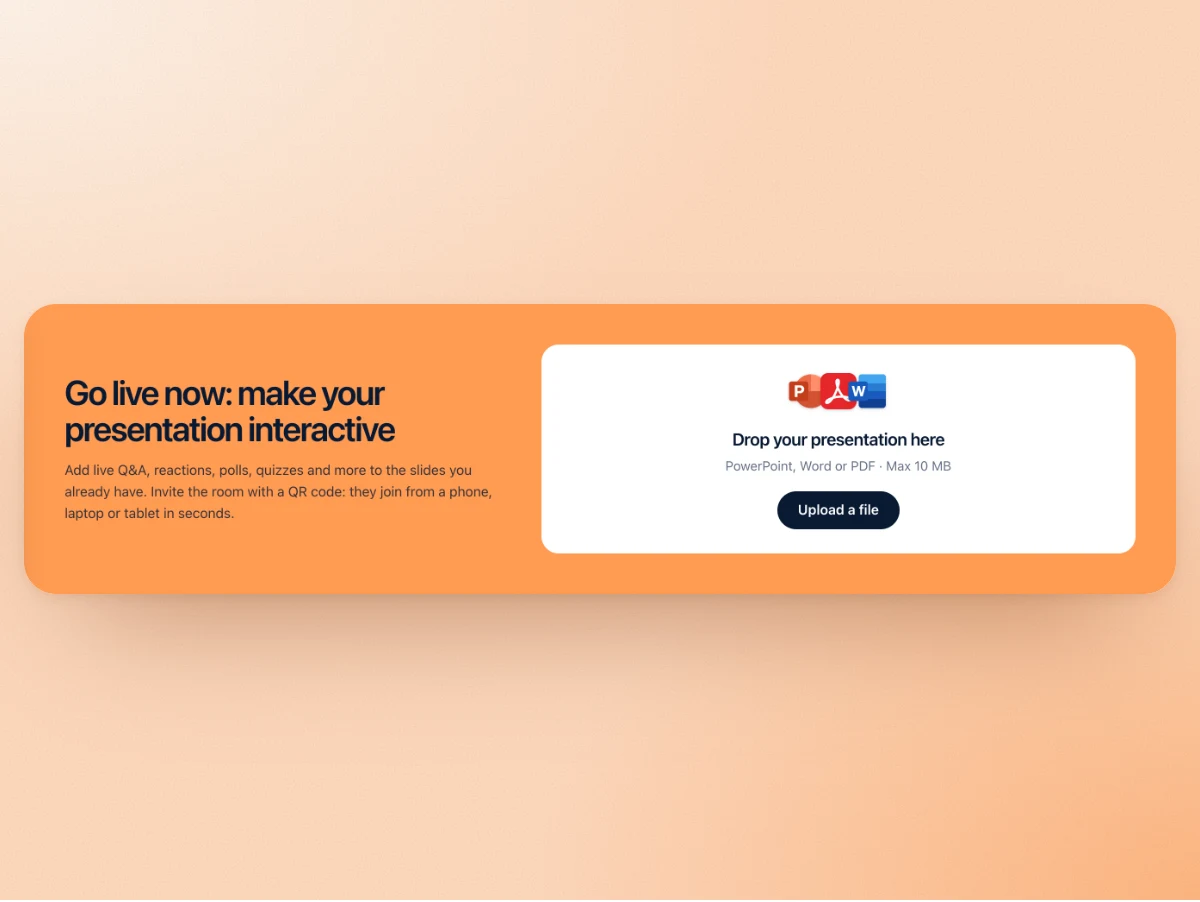
Upload your slides and present. Diaposi counts the answers, the questions and the time on each slide as you go.
End the session
The report is saved to your account by itself. There is nothing to switch on.
Open it from your sessions
Find the session in your list and read its report slide by slide, tab by tab.
Live or in the report: where each figure is
The same session, read twice: at a glance while you present, in full afterwards.
| Signal | Seen live | In the report |
|---|---|---|
| Participants | Their number and their list | A row for each named participant |
| How a slide lands | Got it, Asking, Stuck, with count and percent | Got it and Review for every slide |
| Time | The session timer and the time on the slide | Your time beside the participants' time, slide by slide |
| Questions | All, Top, Pinned, Done | Cards sorted by slide, votes, time or participant |
| Polls | The votes as they arrive | The split of the answers of each poll |
| Quizzes | Answered count, leaderboard, podium | Each question: its split, right answer and explanation |
| Raised hands | With the names | Counted on each participant's row |
What the report shows about a person, and what it never shows
A report is useful only if the room trusts it.
A named participant gets a row
The time they were present, their engagement, how many questions, raised hands, notes and drawings, and their quiz points and rank.
Reactions never carry a name
Got it, Asking and Stuck are counted for the room. They are not tied to a person.
Anonymous stays anonymous
A question asked anonymously sits on nobody's row, live and in the report.
Participants know before they join
Each participant is told what the host sees before joining the session.
Where the figures come from
Every live element of a session feeds the same report.
Hosting is free during the beta.
The host plans are not for sale yet. Export to PDF and CSV, Compare and Progression come with Upgrade: join the waitlist to hear when the plans open.
Frequently asked questions
What are session analytics?
Session analytics are the figures a live session produces: how many people answered, what the room asked and how each slide landed. Diaposi shows them live to the host, then keeps them in one report after the session.
Where do I find the report of a session?
In your list of sessions. The report is saved to your account when the session ends: open the session and read it slide by slide.
Are the analytics in real time?
Yes. While you present you see the number of participants, Got it, Asking and Stuck on the current slide, the questions as they are asked and the poll votes as they arrive.
Can I export poll results to Excel or PDF?
Export to PDF and to CSV, a file Excel opens, comes with Upgrade. Without it, the full report stays in your account and you can open it at any time.
Are the answers anonymous?
Reactions never carry a name, and a question asked anonymously stays anonymous in the report. Participants who join with a name get a row of their own, and each one is told what the host sees before joining.
Can I see each participant's quiz score?
Yes, for participants who joined with a name: their points and their rank, beside the time they were present and how they took part.
What is the session score?
A score out of 100 for the whole session, read from three parts: interaction, participation and attention. It sits at the top of the report with the session time and the polls and quizzes you ran.
Can I compare two sessions?
Compare and Progression come with Upgrade. Run again is open to every host: it starts the same deck again for a new group, with a report of its own.